User guidance for estimating local and network accuracy values: Local accuracy for horizontal and vertical geodetic control points is described as the relative accuracy between local control points and represents the uncertainty of its coordinates relative to other directly connected, adjacent control points at the 95-percent confidence level. The reported local accuracy is an approximate average of the individual local accuracy values between this control point and other observed control points used to establish the coordinates of the control point.
Network accuracy is described as the accuracy of a control that represents the uncertainty of its coordinates with respect to the geodetic datum at the 95-percent confidence level. Network accuracies define how well the absolute coordinates are known. For example, a control point tied into the National Spatial Reference System (NSRS). For NSRS network accuracy classification, the datum is considered to be best expressed by the geodetic values at the CORS supported by NGS. By this definition, the local and network accuracy values at CORS sites are considered to be so small that they approach zero.
Expression of Accuracy: Accuracy has usually been expressed as an “order” classification. With the wide use of GPS, orders are being replaced with point accuracy standards. Hence, the older “order” methodology can be converted into point accuracy by taking the average length of line and multiplying it times the “order” classification of the points to get a point accuracy value.
Example for a horizontal survey: Second-order, class II horizontal survey (1:20,000) with average length line of 12,000 feet: 12,000 x 1/20,000 = 0.600 feet
Example for a vertical survey: Second-order, class II leveling survey (8 millimeters per square-root of the distance in kilometers) with an average bench mark spacing of 1 mile (1.6 kilometers): 0.008 x SQRT [1.6] = 0.01 meters.
Network accuracy for horizontal geodetic control points can be estimated in two ways. First, if the NAD 83 coordinates are consistent with the original NAD 83 adjustment, for example, the original NAD 83 (1986), then the network accuracy has been determined to seldom exceed 1.0 meters. Second, if the NAD 83 coordinates are the result of a statewide or regional High Accuracy Reference Network (HARN) adjustment, then the network accuracy has been determined to seldom exceed 0.05-0.1 meter. If better values have been determined for network accuracy for the area covered by the specific dataset, then those values should be used in place of these general values.
(see www.ngs.noaa.gov for more information related to Local and Network Accuracy)
We also have the new FGDC Accuracy Classifications in the tables below. Use those values when stating your accuracy estimates.
Accuracy Comparitive Table
Error Propagation Table
You can use the Error Propagation Table above to compute the horizontal accuracy of your OPUS results.
Insert the Peak to Peak value for the Latitude from OPUS into the Error 1 slot. Insert the Peak to Peak value for the Longitude from OPUS into the Error 2 slot. The propagated error of the horizontal component will display adjacent to the Error 2 estimate. And to the right, the FGDC accuracy classification will also be shown. This is what you would use in the U-SMART form for Horizontal NSRS Accuracy.
Accuracy: Taken from the NGS Geodetic Glossary 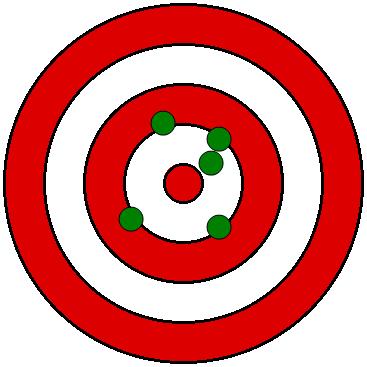
1. Closeness of an estimated (e.g., measured or computed) value to a standard or accepted value of a particular quantity. Accuracy is commonly referred to as "high" or "low" depending on the size of the differences between the estimated and the standard values.
2. The square root of the average value of the sum of the squares of the differences between the values in a set and the corresponding values that have been accepted as correct or standard.
3. The reciprocal of the quantity defined in (2). Accuracy cannot be calculated solely from values based on measurements. A standard value or set of standard values must be available for comparison somewhere in the chain of calculations. The standard of reference may be: (a) an exact value, such as the sum of the three angles of a plane triangle being exactly 180o; (b) a value of a conventional unit as defined by a physical representation thereof, such as the international meter, defined by the orange line of Kr3086; (c) a value determined by refined methods and deemed sufficiently near the ideal or true value to be held constant, such as the adjusted elevation of a permanent bench mark or the graticule of a map projection.
4. Applied to the numbers in a mathematical table or to the numbers produced by a digital computer, the term "accuracy" may mean (a) the number of significant digits in the numbers, (b) the order of magnitude of the least significant digit, or (c) the number of correct places in computations made with a mathematical table. Applied to numbers produced by an analog computer, the term has meaning (1) above, where the "measured" quantities are the computations made by the computer and the correct values are those that would have been obtained by exact calculation.
1. In statistics, a measure of the tendency of a set of random numbers to cluster about a number determined by the set. The usual measure is either the standard deviation with respect to the average, or the reciprocal of this quantity. It is distinguished from accuracy by the fact that the latter is a measure of the tendency to cluster about a number not determined by the set but specified in some other manner.
2. In physics, (in metrology and in the art of measuring generally), precision relates to the quality of the method by which the measurements were made, and is distinguished from accuracy which relates to the quality of the result. The term "precision" not only applies to the fidelity with which required operations are performed, but, by custom, has been applied to methods and instruments employed in obtaining results of a high order of precision. Precision is exemplified by the number of decimal places to which a computation is carried and a result stated.
3. The quantity 1/( ssb 2), where s is the standard deviation of the random variable involved. Also called a precision index or index of precision.
Bias: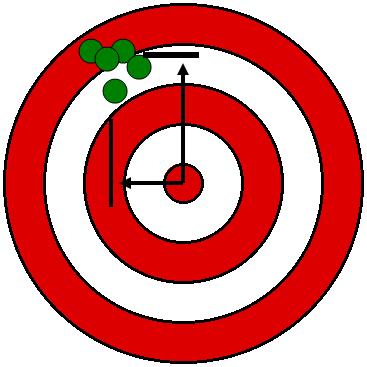
1. The difference between the mean of the measurements and the true value can be caused by a systimatic bias (i.e. uncalibrated level rod, incorrect prisim offset, etc) that causes an error in all measurements.
2. In the image to the right you can see that every position is to the northwest of the truth. This could be caused by a bad backsight, or optical plummet.